For too long, business intelligence in healthcare has been treated as a craft activity — a single analyst building a dashboard in isolation, with no version control, no testing, and no clear path from raw data to production insight. That model breaks down the moment the dashboard becomes mission-critical.
At Brandywine Consulting Partners, we approach BI as software engineering. The same practices that produce reliable applications — source control, code review, automated testing, continuous integration — produce reliable analytics. This article walks through the practices our analytics teams apply on Power BI, Tableau, and Sisense engagements.
Treat Semantic Models as Code
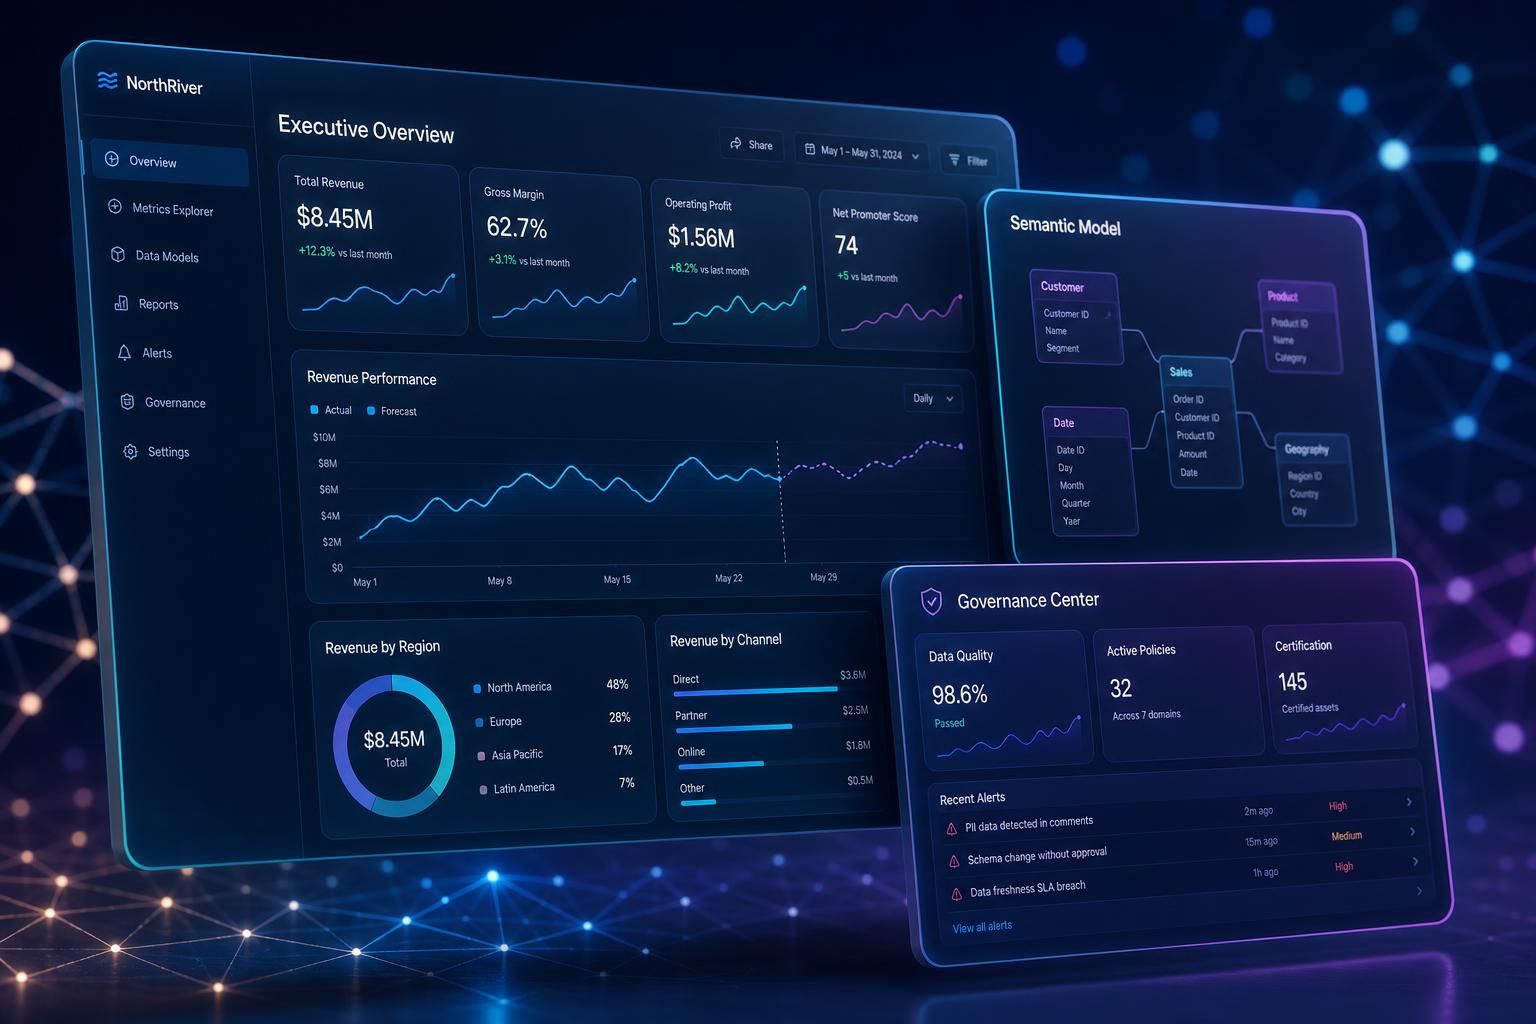
The semantic layer is the heart of any modern BI platform. It defines what a "patient encounter" is, what counts as "in network," how revenue is recognized. When the semantic model is wrong, every dashboard built on top of it is wrong.
We manage semantic models the same way we manage application code:
- ▸Stored in source control with full history
- ▸Changes go through pull requests and peer review
- ▸Automated tests verify that key measures (encounter counts, total revenue, readmission rates) match a known-good baseline
- ▸Releases are tagged and deployed through CI/CD, not by hand
This discipline eliminates the "the number changed and nobody knows why" conversation that plagues so many healthcare analytics teams.
Layer Your Data Architecture
We consistently see better outcomes from a layered architecture: raw landing zone, conformed dimensional model, and presentation marts purpose-built for each consumer. The temptation to "just query the source system" always seems faster in the moment and always costs more later. Layering gives you:
- ▸Clear ownership of each transformation step
- ▸The ability to reprocess history without re-importing source data
- ▸A natural place to apply data quality and PHI controls
- ▸Performance that scales with query volume, not source complexity
Performance is a Design Decision
Dashboard performance is not something you fix at the end. It is determined by choices you make on day one — the grain of your fact tables, your aggregation strategy, your storage mode (import, DirectQuery, composite), your incremental refresh policies. Our teams design for performance up front and continuously profile in production.
A few patterns that pay for themselves:
- ▸Pre-aggregated tables for the most common executive views
- ▸Composite models that combine fast in-memory aggregates with on-demand detail
- ▸Incremental refresh so historical data is not reprocessed every day
- ▸Workspace and capacity sizing matched to actual concurrency, not optimistic assumptions
Build a Tested Path from Source to Insight
The scariest moment in BI delivery is realizing a number on an executive dashboard is wrong. The only protection is automated testing at every layer:
- ▸Source-to-staging tests confirming row counts and key uniqueness
- ▸Transformation tests verifying business rules
- ▸Semantic model tests pinning critical measures to expected values
- ▸Visual-level checks for any dashboard that drives a decision
We run these tests on every change so regressions are caught before they reach business users.
Govern Access Like You Govern Code
In healthcare, who can see what is as important as what the data says. Row-level security, object-level security, and workspace permissions all need to be defined declaratively, version-controlled, and auditable. Our teams treat access policies as part of the deliverable, not as an afterthought.
Document for Decision-Makers, Not Just Developers
A dashboard nobody trusts is a dashboard nobody uses. We invest heavily in plain-language documentation: what the metric means, how it is calculated, what data sources contribute, when it refreshes, and who owns it. This is what turns a one-off report into a durable analytics asset.
Continuous Improvement, Not Big-Bang Releases
The BI landscape changes constantly — new platform features, new data sources, new business questions. Teams that release on a continuous cadence, in small batches, with strong tests, can absorb that change. Teams that release quarterly cannot. Our delivery model emphasizes small, reversible changes and aggressive feedback from end users.
The Result
When you apply software engineering rigor to BI, the outcome is dramatic: dashboards that load fast, numbers leadership trusts, audit trails that satisfy compliance, and an analytics platform that gets better every sprint instead of slowly decaying. That is the standard our clients have come to expect from BCP.
Ready to put this into practice?
BCP partners with healthcare and life sciences leaders to translate strategy into shipped, secure systems. Let's talk about your next initiative.
Talk to BCP